原文:
Serenity 白毛女-中文翻译(公开)
Serenity 白毛女-中文翻译(公开)
原文:
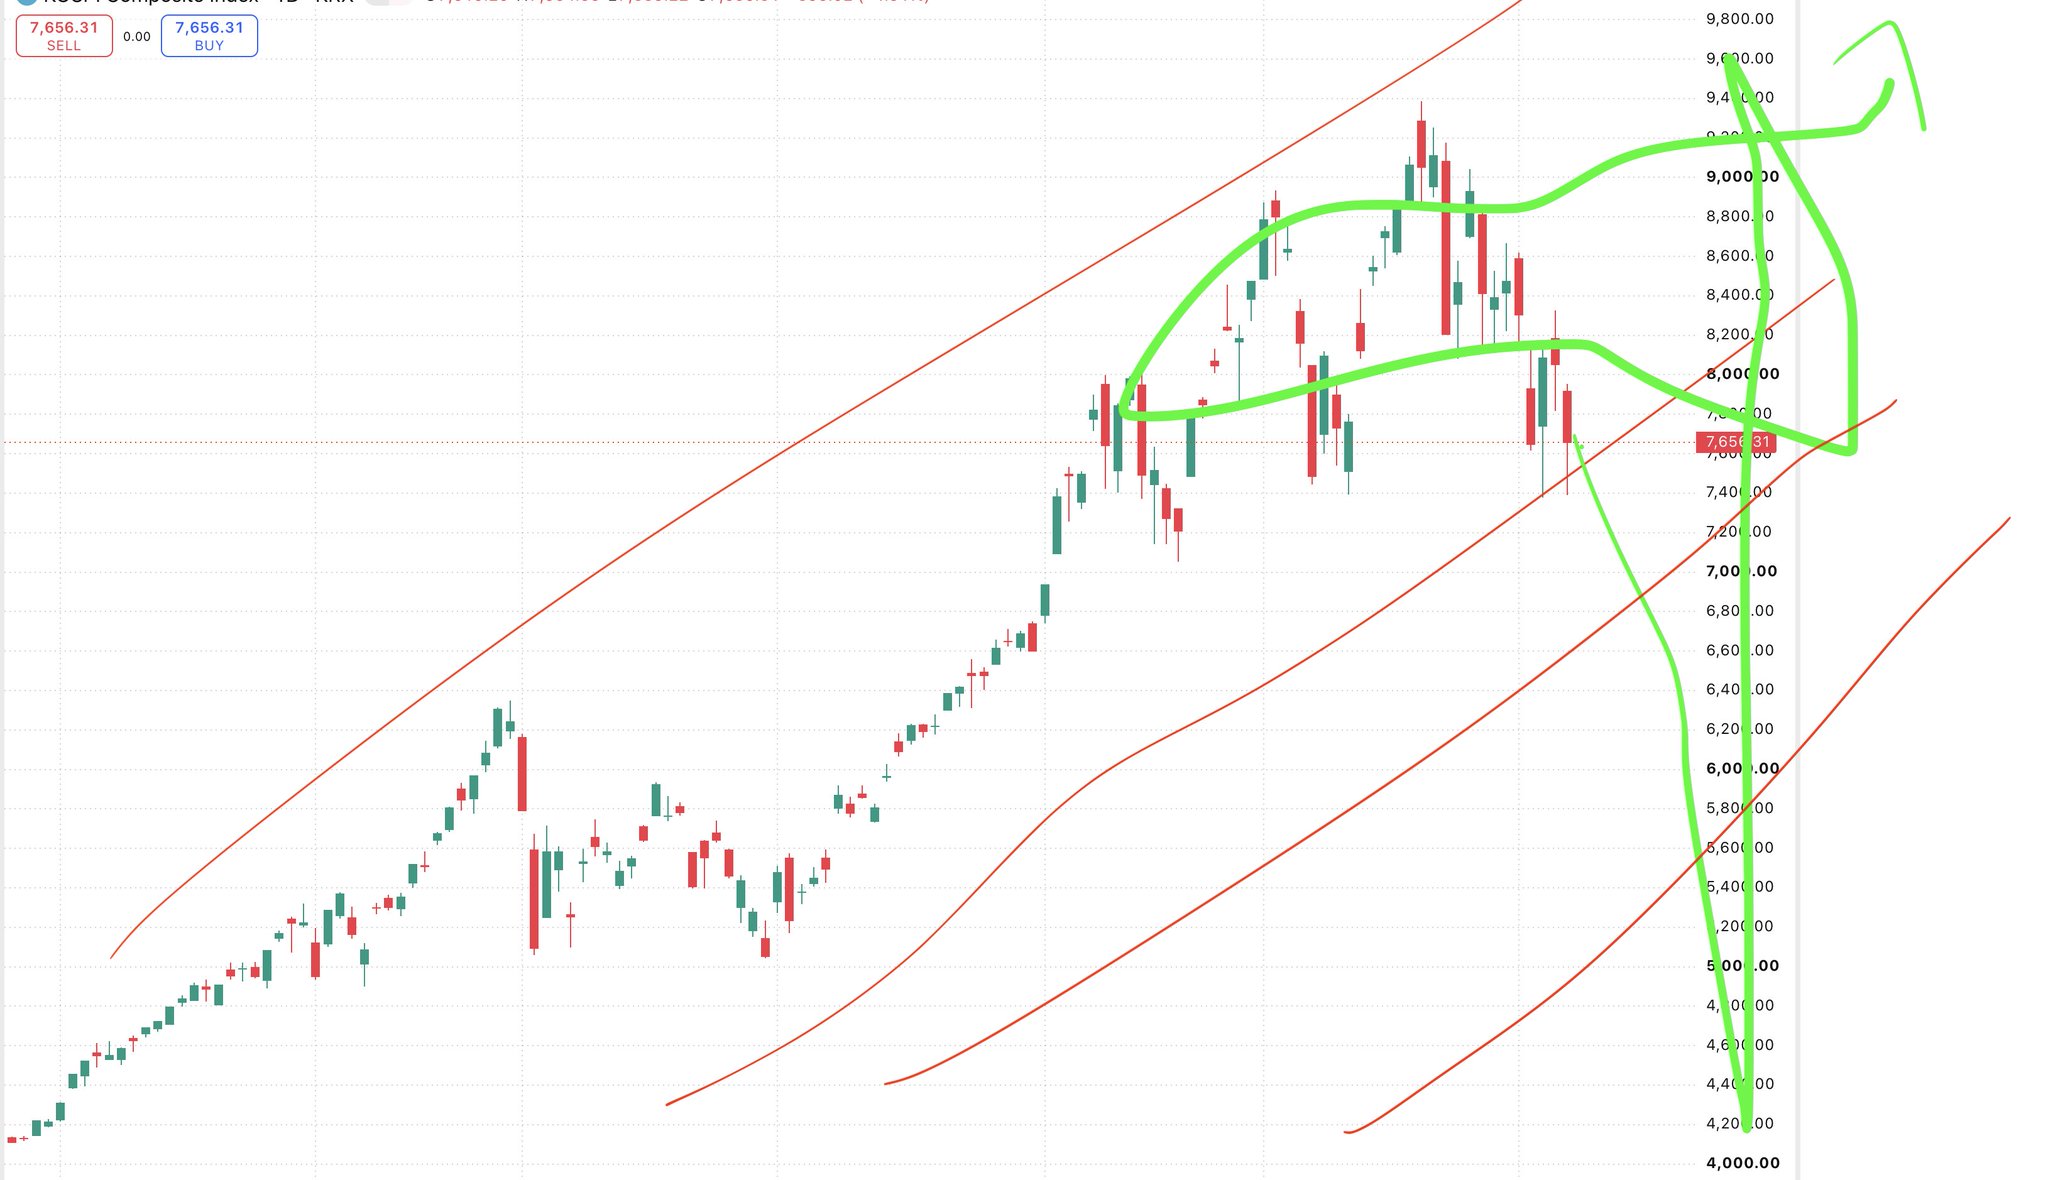
This is the average visual TA bro, takes a 50% 50% coinflip:
If it goes the other way, they say "ABC Pattern Invalidated", should have known...
If they get the coinflip right, they promote their $40/month chart.
-> People drawing swiggly lines over KOSPI mean nothing where it heads. When it's primarily Samsung/SK Hynix and forward operating income growth from DRAM/NAND.
-> The swiggly drawing over $SIVE, $AEHR, and others mean nothing. When it's primarily hyperscaler suppliers, thematic premiums, and volume ramp orders determining valuations.
Then if something randomly goes from $1 to $60 like $AXTI, they claim they spotted it with their "Golden Egg Dragon Candle", while ignoring anything with InP substrate and otpical demand.
There's rare times like these where it's a massive sector drop all together.
But now the TA bros are showing up everywhere saying
here's a $40 course on how they predicted it with swiggly lines.
翻译:
这是典型的视觉技术分析,基本上就是抛硬币,五五分:
如果结果与他们预测相反,他们就会说“ABC 模式失效”,应该早就知道了...
如果他们猜对了,他们就会推销自己的 40 美元每月的图表。
-> 在 KOSPI 上画波浪线毫无意义,因为它的走势主要取决于三星、SK 海力士和 DRAM/NAND 的营业收入增长。
-> 在 $SIVE、$AEHR 等股票上画波浪线也毫无意义,因为它们的估值主要取决于超大规模供应商、主题溢价和订单量的增长。
然后,如果某只股票像 $AXTI 一样从 1 美元涨到 60 美元,他们就会声称自己通过“金蛋龙烛”发现了它,同时忽略了任何有关 InP 基板和光学需求的信息。
像这样的情况很少见,整个行业都经历了大幅下跌。
但现在,技术分析师们到处出现,声称他们可以通过波浪线预测市场走势,并推销 40 美元的课程。
This is the average visual TA bro, takes a 50% 50% coinflip:
If it goes the other way, they say "ABC Pattern Invalidated", should have known...
If they get the coinflip right, they promote their $40/month chart.
-> People drawing swiggly lines over KOSPI mean nothing where it heads. When it's primarily Samsung/SK Hynix and forward operating income growth from DRAM/NAND.
-> The swiggly drawing over $SIVE, $AEHR, and others mean nothing. When it's primarily hyperscaler suppliers, thematic premiums, and volume ramp orders determining valuations.
Then if something randomly goes from $1 to $60 like $AXTI, they claim they spotted it with their "Golden Egg Dragon Candle", while ignoring anything with InP substrate and otpical demand.
There's rare times like these where it's a massive sector drop all together.
But now the TA bros are showing up everywhere saying
here's a $40 course on how they predicted it with swiggly lines.
翻译:
这是典型的视觉技术分析,基本上就是抛硬币,五五分:
如果结果与他们预测相反,他们就会说“ABC 模式失效”,应该早就知道了...
如果他们猜对了,他们就会推销自己的 40 美元每月的图表。
-> 在 KOSPI 上画波浪线毫无意义,因为它的走势主要取决于三星、SK 海力士和 DRAM/NAND 的营业收入增长。
-> 在 $SIVE、$AEHR 等股票上画波浪线也毫无意义,因为它们的估值主要取决于超大规模供应商、主题溢价和订单量的增长。
然后,如果某只股票像 $AXTI 一样从 1 美元涨到 60 美元,他们就会声称自己通过“金蛋龙烛”发现了它,同时忽略了任何有关 InP 基板和光学需求的信息。
像这样的情况很少见,整个行业都经历了大幅下跌。
但现在,技术分析师们到处出现,声称他们可以通过波浪线预测市场走势,并推销 40 美元的课程。
Could not load this section.